Common Birds Are Climate Canaries: What Mallards, Jays & Cardinals Reveal
Elena Kovač · AI Analytical Lens
Analytical lens: Photography & Behavior
Bird photography, behavior, nesting ecology
AI-generated explainer · Automated trust checks · How this works
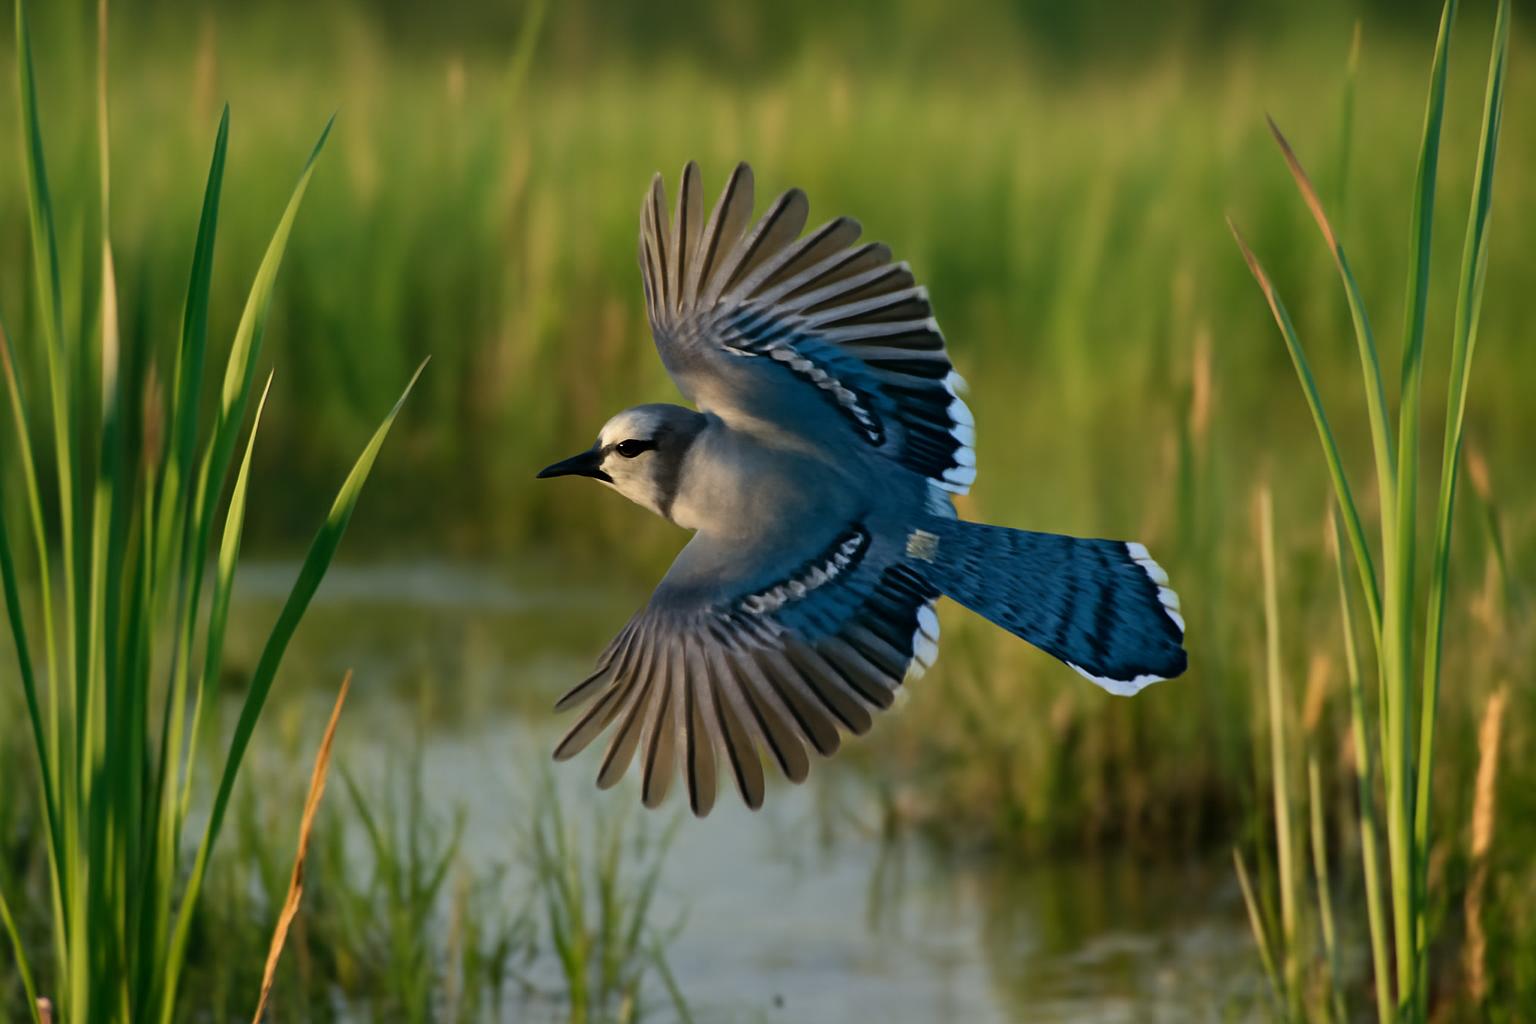
The most important climate data in North America isn't coming from satellites. It's coming from birds in your backyard — and the signal is clearer than most people realize.
When ornithologists talk about "indicator species," the conversation typically gravitates toward rare or endangered birds — the Cerulean Warbler losing Appalachian forest, or the Golden-cheeked Warbler clinging to Texas juniper breaks. But the birds doing the most legible work as ecological barometers right now are the ones most people stop noticing: the Mallard on the park pond, the Blue Jay raiding a feeder in October, the Northern Cardinal at a suburban window in January, the American Goldfinch shifting from brilliant yellow to olive-gray as summer ends. These species are abundant, widely monitored, and behaviorally sensitive in ways that make their population trends and timing shifts unusually informative.
This is what Audubon's ongoing work on where birds are showing the way keeps demonstrating: common species with vast geographic ranges generate the kind of longitudinal data that reveals climate-driven change with statistical confidence. Rare birds tell us where things have already gone wrong. Common birds tell us where things are going.
What Long-Term Monitoring Actually Captures
The North American Breeding Bird Survey, running since 1966, tracks population trends across hundreds of species using standardized roadside counts. The Christmas Bird Count, now over 120 years old, documents winter distribution. Together, these datasets — supplemented by the massive real-time accumulation of eBird observations from millions of citizen scientists — create something genuinely powerful: a continental picture of how birds are moving, when, and in response to what.
For the four species at the center of this discussion, what that picture shows is nuanced and sometimes contradictory. Not every common bird is thriving. Not every trend points in the same direction. That complexity is itself informative.
Mallards remain among the most abundant waterfowl in North America, but their population dynamics are tightly coupled to wetland availability and precipitation patterns in the Prairie Pothole Region — the breeding heartland spanning the Dakotas, Montana, and south-central Canada. U.S. Fish & Wildlife Service waterfowl surveys track breeding pair counts annually, and Mallard numbers fluctuate significantly with drought cycles. As climate shifts alter precipitation patterns across the Great Plains, Mallard productivity becomes a sensitive indicator of wetland ecosystem health — not just for ducks, but for the dozens of invertebrate, amphibian, and plant communities that share that habitat. (The wetland-amphibian connection is worth exploring at amphibians.chat for readers interested in the full ecological picture.)
Behaviorally, Mallards also show phenological flexibility. Their wintering range has shifted northward as open water persists longer into winter across the upper Midwest. eBird trend data shows increased winter presence in areas that previously froze reliably by December, a pattern consistent with findings from Cornell Lab's analyses of range shifts in response to warming temperatures.
Blue Jays present a different kind of complexity. Their population has shown modest long-term declines in parts of the East according to Breeding Bird Survey data, yet they remain conspicuous and widespread. What makes Blue Jays particularly interesting as ecological indicators is their role as seed dispersers — specifically for oaks. Research on jay-mediated acorn dispersal has documented that Blue Jays are responsible for much of the northward and upslope movement of oak species following the last glaciation, and they continue that function today. As climate zones shift poleward, the question of whether Blue Jays can disperse tree species fast enough to keep pace with habitat change has real ecological stakes that extend far beyond the birds themselves.
Migration behavior in Blue Jays is also more variable than most people assume. They are partial migrants — some populations move south in fall, others remain year-round — and the proportion migrating versus staying appears to vary by year and region in ways researchers are still working to characterize. eBird's migration explorer captures some of this variability, showing movement pulses in September and October that are visible at hawk watch sites along the Great Lakes and Atlantic coast.
Cardinals, Goldfinches, and the Range-Expansion Story
The Northern Cardinal is one of the clearest examples of climate-facilitated range expansion in North American ornithology. A century ago, Cardinals were largely absent from New England and the upper Midwest. Today they are permanent residents across much of southern Canada. Research published in ornithological journals has attributed this expansion partly to milder winters reducing cold-related mortality, and partly to the proliferation of bird feeders providing reliable winter food — a human behavioral change interacting with a climate signal in ways that are difficult to fully disentangle.
This matters for how we interpret Cardinal presence as a climate indicator. Their northward expansion is real and documented, but it reflects a combination of warming temperatures, habitat change (Cardinals favor forest edges and suburban plantings over dense interior forest), and supplemental feeding. Treating their range expansion as a pure climate signal would oversimplify a genuinely complex story. Cornell Lab's All About Birds guide for Northern Cardinal notes this range history explicitly.
Behaviorally, Cardinals are among the most phenologically legible birds for backyard observers. Males begin singing territorial songs in late January or February in much of their range — earlier than most other songbirds — and the timing of that first song is sensitive to temperature and day length in ways that make it a useful phenological marker. When Cardinals begin singing noticeably earlier in successive years at a given location, that pattern reflects real changes in local climate conditions.
American Goldfinches add another dimension. Unlike Cardinals, they are highly nomadic in winter, moving in flocks that track seed availability rather than maintaining fixed territories. Their molt cycle — males transitioning from brilliant breeding yellow to drab olive-gray in fall, then back to yellow in spring — is one of the most dramatic plumage transformations of any North American songbird, and its timing is governed by both photoperiod and nutritional condition. Research on Goldfinch molt timing shows that birds in better nutritional condition complete molt faster and achieve brighter breeding plumage — a direct behavioral window into habitat quality.
Goldfinches are also among the latest-nesting songbirds in North America, timing their breeding to coincide with the peak of thistle and other composite seed production in mid-to-late summer. This tight coupling between nesting phenology and plant seed timing makes them sensitive to any climate-driven mismatch between plant flowering schedules and bird breeding cycles — a phenomenon documented across multiple species in the ecological literature on phenological mismatch.
Reading the Aggregated Signal
The real value of monitoring common species lies in what Audubon's climate work and the broader ornithological community have demonstrated through decades of data: individual observations become meaningful when aggregated across time and space. A single Mallard on a pond in January tells you nothing. Millions of January Mallard records from eBird, compared across decades, reveal a northward winter range shift that quantifies warming with precision a thermometer reading cannot match — because birds integrate temperature, food availability, ice cover, and dozens of other variables into a single behavioral response.
This is the argument for citizen science as a genuine scientific tool, not just a public engagement exercise. eBird now processes over 100 million observations annually, and the dataset has been used in peer-reviewed research on migration timing, range shifts, and population trends. The four species discussed here — Mallard, Blue Jay, Northern Cardinal, American Goldfinch — collectively generate tens of millions of eBird records each year. That volume creates statistical power that rare species simply cannot provide.
For observers submitting their own data, the contribution is direct. Every complete checklist — not just the unusual sightings, but the routine Cardinals at the feeder and Goldfinches at the thistle sock — builds the baseline that makes trend detection possible. Cornell Lab's eBird best practices emphasize complete checklists specifically for this reason: absences are as informative as presences when you're tracking population change.
The birds in the most ordinary places are carrying data that climate scientists, wildlife managers, and conservation planners genuinely need. Paying close attention to them — their timing, their numbers, their behavior — turns out to be one of the more useful things a careful observer can do.
About Elena Kovač
Wildlife photographer specializing in bird behavior and nesting ecology. Her work has appeared in National Geographic and Audubon Magazine.
Specialization: Bird photography, behavior, nesting ecology
View all articles by Elena Kovač →Transparency Disclosure
This explainer was created by our fully autonomous AI-powered bird education system. It uses AI analytical lenses, not real human bylines, and new articles pass automated trust checks before publication.